Christmas Lights, Pedestrians and Machine Learning – Part 2

We finished Part 1 having calculated an adjusted total of 51,144 people visited our Christmas light display (many multiple times). This adjusted total was estimated based on the results of nearly 20,000 images being processed by AWS Rekognition and a simple algorithm being applied.

As we eluded too, this number may have underestimated the total crowd and the reason for this is to do with the accuracy of the Rekognition model with the data we captured. This isn’t to say Rekognition isn’t accurate, more so the images we feed the model were not optimised. The example below shows the raw image we captured and then the same image if we adjust the brightness, contrast and sharpness of the picture.

Raw (left) verse adjusted Images(right)

As you move the slider above from side to side you can see there is a lot more people present than first apparent when the image parameters are adjusted (brightness, contrast, sharpness).

The Rekognition model was also able to detect more people with the adjusted image, detecting 15 people in the raw image and 22 in the adjusted image. The main changes are in those areas that in the raw image are dark and become lighter and clearer.

Rekognition results raw (left) v adjusted image (right).

In both instances, the model doesn’t pickup everyone that is present in the image and this lead us to try building a custom made model for this scenario in an attempt to get better results.

Targeted Model Development

In some of our other ML/AI projects we have been using a tool called Darwin which is developed by v7Labs. The Darwin product allows users to create and then refine ML models based on data specific to the user. You can read more about Darwin here and we’ll dive into the process we used now.

Using Darwin the first step is to upload some images to train the model on, open them and start labelling. As can be seen in the raw image below, the camera and lighting conditions were not optimal for even humans to detect pedestrians in the image.

Raw image in Darwin

Fortunately, Darwin has a built in image manipulation tool and adjusting some of the parameters (contrast, brightness) the people in the image become easier to see to the human eye. Next we draw the bounding boxes around all the people we can see. The image below shows the adjusted image, that has been partly annotated (drawing labels). Once all the people have been identified by the labeller (a person), the image is sent for peer review.

Adjusted Image with several bounding boxes draw.

Darwin recommends that at least 500 samples are needed before a model should be trained. For this project we processed 1,500 images and labelled 5214 people in them before training our first and second models.

Once the model was finished training, we tested it out running both Rekogition and Darwin against the same image to establish which was more accurate. We limited the head to head comparison to the images from the 23rd and 24th December, as they were had the most people detected by Rekogition in the first instance.

Adjusted daylight image

Starting with the 23rd December, we had to split the data into two (2) groups, with the first group was “natural day light” and the second group was “No Natural Light”. The reason for this split was to enable specific pre-processing (tweaking the brightness & contrast) of the dark images before passing them to the models for evaluation. If we applied the same image manipulation to the daylight images we ended up with “all white” (to the right) pictures with nothing visible (not great for counting people!).

The graphs below summarises the results of the two (2) models for the 23rd and 24th Dec 2021.

Graphed results of the model comparison

The table below summaries the results of both models.

Results table from the model comparison

As can be seen in both the graphs and the tables, the specifically trained Darwin model was able to detect a much larger number of people in the adjusted images. A quick random sample shows the comparative results of the models, but also shows neither model is 100% accurate in detecting all of the people present in the captured images. The images below so the base adjusted image, then the rekogition detection and then the Darwin detection results.

Now looping back to where we started, was the number of people detected higher or lower than our original estimates? Based on the Darwin results we could reasonably say the number of people that visited the lights display was higher than first estimated using the targeted model. The number of people detected in the samples from the 23rd and 24th December were 2.1 higher (see below) than Rekogition and then applying the ‘overlap’ factor of 50% would have over 30,000 people visiting on 2 nights!

Table Comparison

In Conclusion

Based on the images analysed using the 2 different models, and many manual inspections of the images, we can conclude that there was a lot (very scientific term!) of visitors to our lights. The exact number is in the 10’s of thousands but based on the limitations of our camera location, lighting and algorithms we are not able to give a definitive number!

Next up, we’ll look at the lessons we’ve learnt and the changes we’ll make for the 2022 Christmas Light show!
Christmas Lights, Pedestrians and Machine Learning – part 1

It’s beginning to feel a lot like Christmas (well is was when I started this post!) and with our street getting into the Christmas lights in a big way, I saw an opportunity to tweak some of our FatigueM8 Machine Learning (ML) features. Our FatigueM8 unit has a forward facing camera that captures the road and traffic conditions that our drivers are operating in, and its’ a part of the system that has remained relatively unchanged for a long time. The process is straight forward, capture a still image at regular intervals (notionally 10 seconds), upload it to the cloud (AWS in our case) and using ML to determine the road and traffic conditions; before recording the results.

In our prototype FatigueM8 units we leverage an AWS service called Rekognition (read more about it here). Rekognition is really easy to use and quite accurate for our purposes, the image below show’s the raw image captured from the FatigueM8 and then based on what Recognition is able to detect in the image.

We apply the green Bounding Boxes based (as shown on the “Labelled” image) on the information returned from Rekognition. Interestingly, the white VW Amarok that was directly in front of the FatigueM8 unit wasn’t identified as a Car or Truck – we’ll come back to this later). Rekognition returns the name of the object, the confidence of the object’s type and the object’s coordinates in JSON format as is shown below.

[{"Name": "Car", "Confidence": 99.19426727294922, "Instances": [{"BoundingBox": {"Width": 0.3071940541267395, "Height": 0.16058334708213806, "Left": 0.6081644296646118, "Top": 0.0007275581592693925}, "Confidence": 99.19426727294922},

So how does this relate to Christmas lights? Well with our street going all in and the menace that is SARS-COV-2 lurking about I thought it might be useful to understand the crowd numbers visiting our Christmas lights (check out the ABC Canberra’s video of our lights here).

We adapted one of our older FatigueM8 units, rehoused it into a waterproof case and used an OEM RaspberryPi camera casing. After testing the installation on the side of my house I noticed the angle of the camera wasn’t the best and so we created a stand and in the interests of time, just used cable ties to connect the stand to the casing (classy I know).

The Pedestrian Monitor unit used the same code logic as FatigueM8 capturing an image every five (5) seconds, passing it to AWS Rekognition and recording the results.

We used a simple algorithm to determine the validity and accuracy of the results returned. The first step was to filter based on the time of day, as most people would look at the lights after dark. Given each Rekognition scan has a cost ($0.0005) we didn’t waste processing effort or $$ if the probability of people being viewing the lights was low. For this reason we only sent images to Rekognition between 4pm-11pm.

Below is an example of one of the images captured around 6pm and also one from 10pm; noting the camera wasn’t a night vision camera the later images are pretty dark.

It’s important, the pictures were captured from far enough away, and a resolution so not as to be able to identify individuals; and in this area is also CCTV cameras operating 24/7 365 days a year .

We also filtered the results based on the confidence of a person being present and even at > 70% confidence we saw a range of false positives (People being detected where none were). The images below show a couple of examples were the confidence was > 70% but < 80% that person was detected, and as you can see there is no person visible.

So let’s look at the finding, across the Christmas period. The graph below plots the Average, Median and Maximum number of pedestrians present (using Rekognition) for each day between 4pm and 11pm. The graphs shows a steady build up to peak on Christmas Eve and then a rapid fall away from Christmas night.

Graph of the Max (Blue), Median (Black) and Avg (Orange) pedestrian counts

The dip on the 22nd Dec was due to system outage and therefore reduced data collection occurred – otherwise we’d estimate the numbers would have been similar to those either side of it.

The graph below shows the number of people observed, grouped by hour and as is evident, the number of people increased the darker it was. The data collection finished at 11pm – when the Christmas Lights were switched off.

One thing that isn’t clear in the above graph is that the highest number of people observed at once, was in the 8pm time slot (20 in 24HR time) and it peaked at 31 people.

Calculating the total number of pedestrians is not without its challenges – as we (purposely) didn’t capture enough detail to track/confirm an individual is present from one image to the next. Our manual inspections of the data showed a level of cross over between images (estimated to be 40%) where a person or group of people are present in successive images.

The second element was number of False Positives present is quite high while there is natural light present on the area that’s being captured (we’ll investigate why this is at a later point in time). A manual inspection of the data from the 24th Dec 2021 showed the a 70% False Positive rate through the 4pm-7pm window. Across the month of data capture during the 4pm-7pm window a raw total of 7083 people were observed, however reducing that number by the false positives (70%) brought it down to 2125 people observed.

Applying the cross over factor (40%) the number reduced to 1,275. Noting there was 26 days of data collection (we missed a couple in the middle) and between 4pm and 7pm is 3 hours, the estimate for pedestrians during this time band was 16 per hour (which based on the manual inspections .

Looking at the time period from 7pm to 11pm the raw total was 85,240 which is huge! But this drops to 51,144 when the crossover factor is applied (still rather large!). Breaking that down by Day, then Hour gives an average of 655 people per hour at peak time!

The total seems high, but as we’ll look at in the next instalment of FatigueM8 Friday, it may not be quite high enough!

Until Next time, stay safe.

What does 15 months look like?

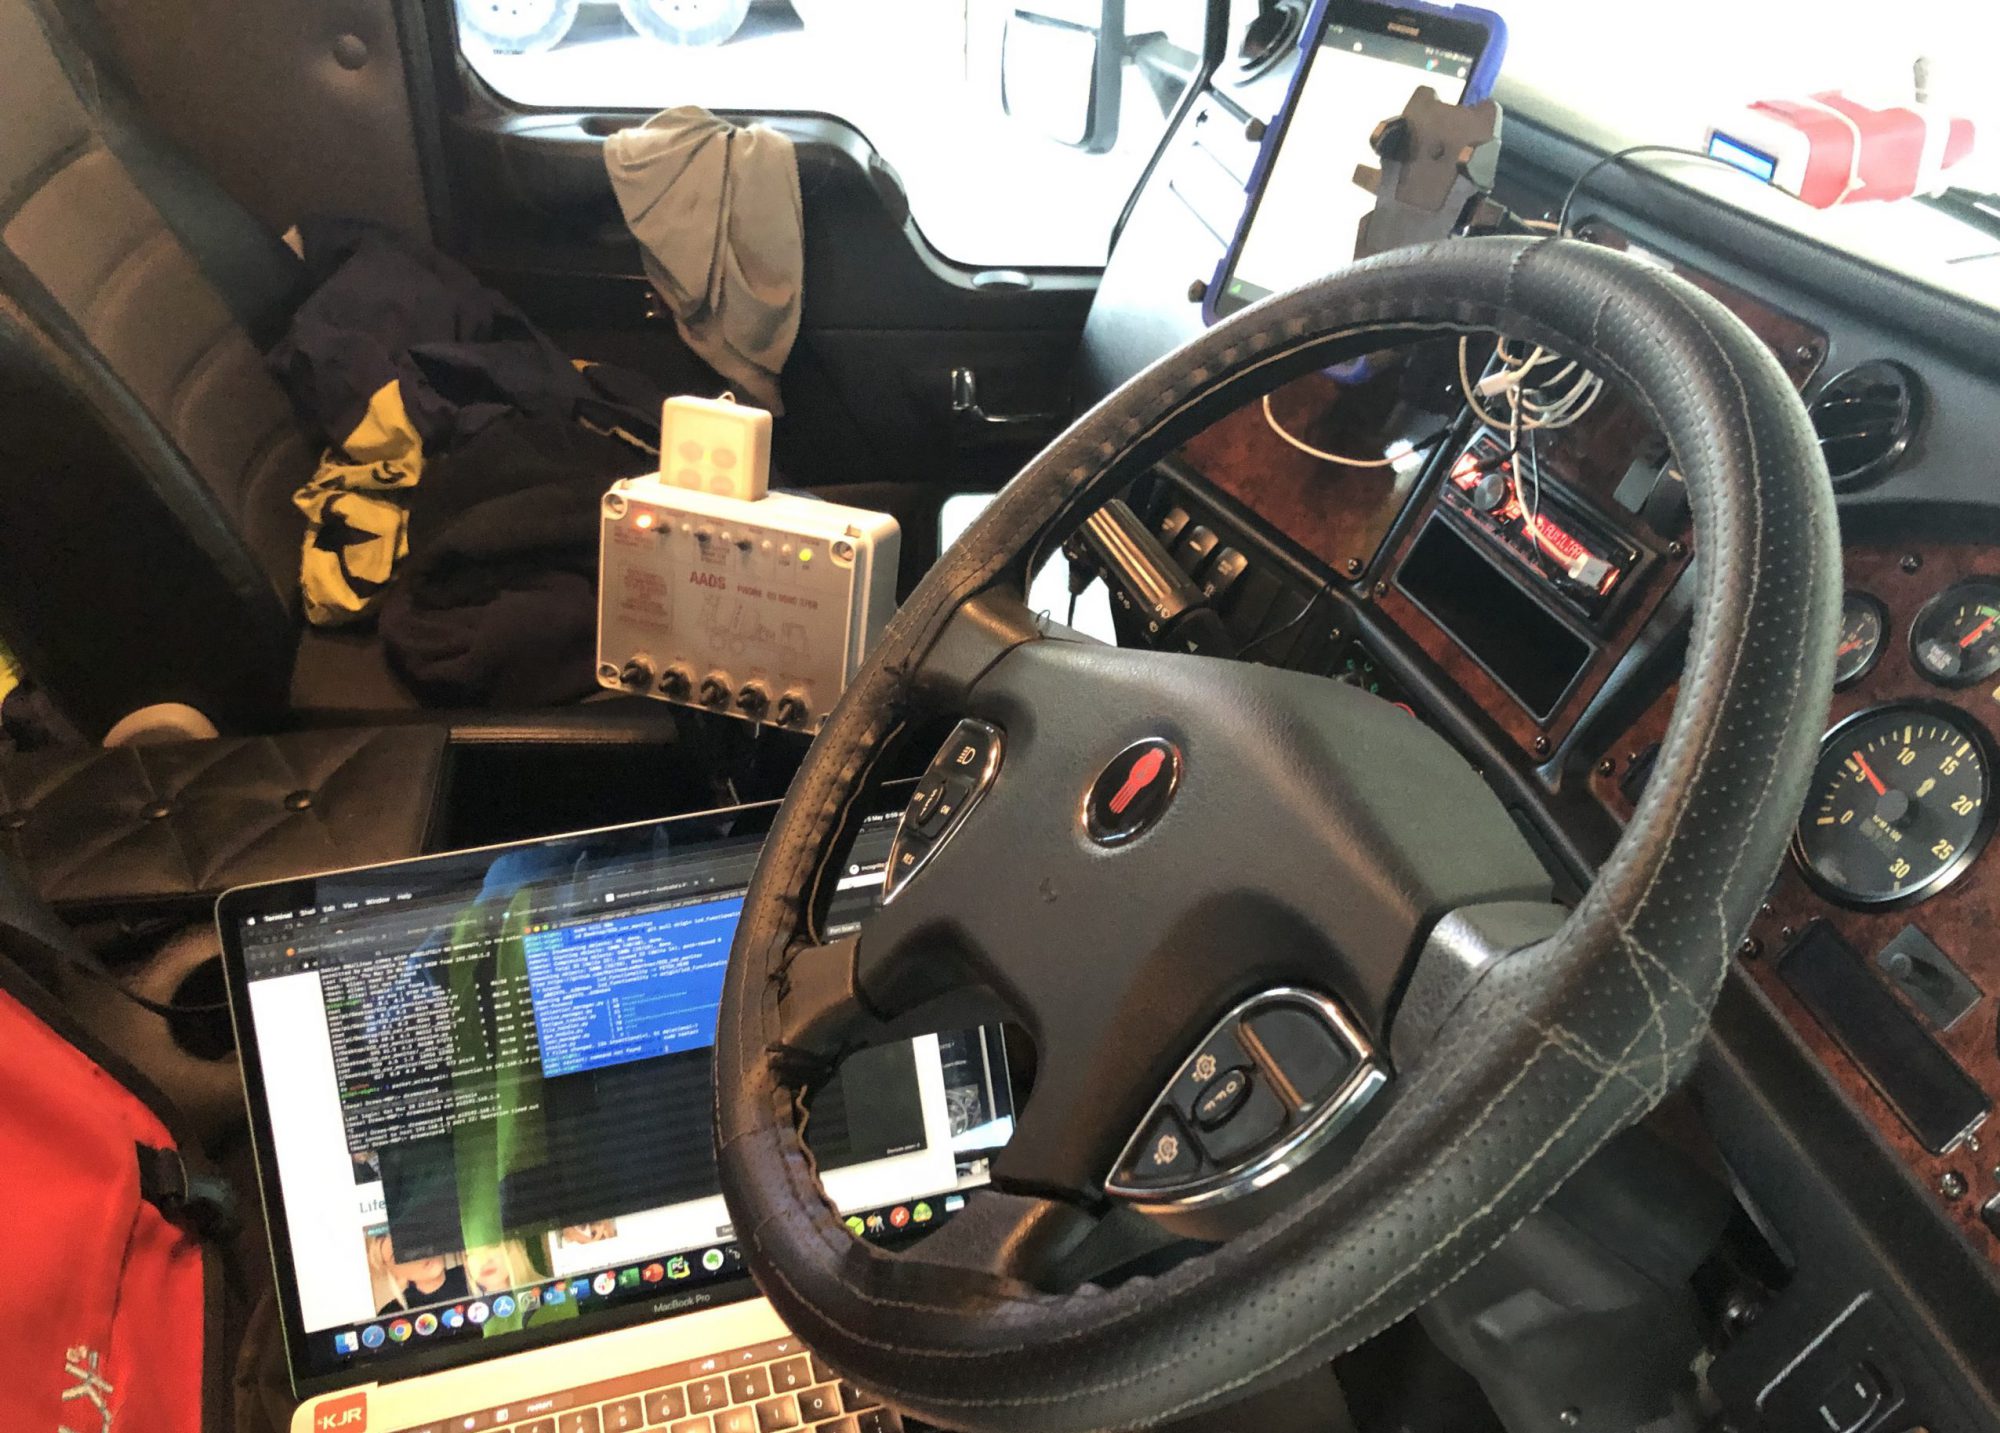
Recently we travelled up the highway to pick up one of our FatigueM8 units. This unit is due for an upgrade and as it was one of the first we installed some 15 months ago!

According to the timestamp on the photo on my phone, around lunchtime on the 1st July 2020 we kicked off the installation. Since we completed the installation this big-rig has been carting sand and gravel up and down the Hume Highway 6 days a week pretty constantly.

collected unit (left), new cover (right)

The compute unit was a little dusty and the colour is a bit faded, but otherwise in great working in order.

The steering wheel over on the other hand was quite worn and the pattern of wear was interesting as there had been several drivers in this truck over the past 15 months.

As can be seen in the photo below, highlighted in yellow, the right hand side of the steering wheel cover is quite worn. This cover was made out of tanned leather and the top layer has worn off the section 1 and 2. The conductive stitching has also been worn off the section from 1,2 and 4.

This pattern suggests that the drivers regularly drove with there right hand on the wheel, most likely with the palm of their hand around the area of most wear.

Interestingly, the underside of the steering wheel also tells a story, in section 1 the stitching where the drivers fingers would be is still in good condition, where as the stitches near section 2 is worn. Its like that a driver adopting a “10-2” hand position would cause this pattern.

There was less wear on the left hand side of the steering wheel cover (below), which considering most people are right-handed does stand to reason. On the left hand side we can see that the stitching has been mostly worn off the top and a little bit on the underside, but no large patches were the shiny leather has been removed.

Reviewing the wear patterns helps us to improve the steering wheel cover design. In our latest steering wheel covers we’ve adjusted the stitching pattern to take into account wear such as can be seen on this example. Now we focus the stitching on the underside of the cover, where the finger tips will come into contact and have all but removed stitching on the top of the cover. It’ll be interesting to see the state of future covers after 15 months use!

Solar Sunday (a COVD Lockdown expirement)

A core part of our system is the collection of the electrocardiogram device that collect the drivers ECG observations. In all of our prototype units we tap into the power that runs through the steering column, and as a backup we have a small battery (as can be seen in the unit below).

FatigueM8 power pack

During our data collection trials in late 2020 and through 2021 we’ve observed that if the trucks are “parked up” for a period that our ECG collection doesn’t automatically restart when the truck does.

It’s taken a while to be able to replicate this, but thanks to the ACT Lockdown we have been able to replicate this circumstances and the behaviour with the unit. The short term fix is to reset the ECG unit once the Truck’s back in operation and the battery is recharged. Its a quick fix once you’re inside the truck, however downside to this fix is if the unit is in a truck that is being driven around the remote areas of Queensland, then it isn’t such a quick fix!

During the ACT lockdown we began to experiment with a solar panels to keep the charge up in the battery unit (below).

The thinking was/is, that when most trucks are “parked up” they will be outside and exposed to the sun. The small solar panels (below) we are testing (pleasingly) provide enough power to charge the battery and prevent the ECG unit from entering ‘sag’ mode.

As, as can be seen in the photos’ below, small enough too, theoretically, be fixed onto the horn cover of some of the models we currently support.

At this stage we’re testing the practical application of this configuration in our test vehicle, and if it proves to be a winner we may shift to in-truck trials late-2021 or early 2022. The early indications are positive, so watch this space.

Big Rigs September 3rd write up

It’s FatigueM8 Friday! This week I’m super excited to share our latest write up in this week’s Big Rigs Newspaper (page 10). 

Big thanks to the team at Big Rigs Newspaper for the chat and writing the article. A big shout out to our trial partners around Australia who’ve been helping us test, iterate and improve our FatigueM8 solution, especially over the past 12 months. We couldn’t make progress without your support and patience. 

read the article here as well as the rest of the Big Rigs edition.

GPS Mystery Character puzzle, solved via an unusual solution

The ACT lockdown as had it’s up sides, no commuting, limited after school and social activities has meant that I’ve had time to tackle the GPS mystery that’s been bugging me for some time.

A while back I noticed the GPS tagging of the data collected in my Van had stopped. This was somewhat unusual as I hadn’t changed anything (famous last words). When I investigated the issue I found that the feed started to appear corrupted, with the steam of characters displaying symbols and partially decoded (as can be seen below).

I’d invested a number of potential sources of the corruption, tried stopping and restarting, pulled the unit apart to check the wiring and then tried changing the decoding from UTF-8 to an alternate encoding; also reset the WiFi region (random I know but Dr. Google suggested it!!). Finally I thought it could of been the frequency of the data feed, so I also tinkered with the frequency of reading the stream. None of these worked. Interestingly I had tested the FatigueM8 unit on the test-bench and the GPS was working fine. I hadn’t joined the dots at this point.

On returning the unit back into my car, and while awaiting a COVID-19 Test I noticed that the Wifi in my car wasn’t working. Both the FatigueM8 and the 3G/4G Wifi dongal are plugged into a 12v cigarette lighter socket.

I removed the cigarette socket to debug the issue with the wifi, there wasn’t anything noticeability wrong with the wifi dongal, but I did notice the Amperage values on the socket. When setting up the system I had made sure to plug the Compute unit into the 2.1A slot as it needed more power than the wifi dongal. This time when I plugged everything back together I made sure again to put the Compute unit into the 2.1A and the wifi dongal into the 1A slot.

And what do you know, when I started it all up the Orange GPS light flashed on and stayed on (signalling a GPS fix was detected). When I looked at the stream via the logs it was back to being the standard NEMA strings and the GPS was back! Of all the things I thought was causing the “corruption” low power was certainly not high on the list of things to check!!

The GPS hasn’t missed a beat since.

Until next time, stay safe.

Stitching by torchlight

On one of my recent trips to Mount Isa I arrived at the yard to inspect one of our FatigueM8 trial units. Walking through the gate, there was a small group of drivers preparing to start the graveyard shift (approximately 6pm at night). They greeted me with a smile and asked “are you here to fix the steering wheel?”. I’m not really sure what gave it away, but I said, “yes, that’s me” and one of them piped up and said, “can you fix the cover, it’s coming loose and if it gets much worse someone will pull the {insert adjective here} off”.

This particular unit is installed into a quad-trailer road train, which operates 24/7 in and out of the mines around Mt Isa (read more here). It’s the most extreme conditions we’ve had our FatigueM8 installed in. On this particular night it was still 30+ degrees and the yard Forman commented that “yesterday the temperature top 50 degree’s in the shed”.

After a brief chat with the team I wondered into the main shed and found the Truck. Climbing up into the cabin I quickly saw what they meant.

Some of the stitching had broken and the cover was a bit loose. Interestingly my interpretation of where the stitching broke was where I believe most of the right-handed drivers would be holding the wheel or resting their hands on the wheel.

On this, and most trips now I travel with a complete replacement FatigueM8 unit. I set about replacing the steering wheel cover and it was well into the evening.

A resting install of the cover takes about 45 mins and this was the first time I’d stitched one under torch light!! The end result was solid and the unit was back ready to hit the road when the 5am crew came in the next morning.

Catch next time.

Thermodynamics lesson

This week we have a quick look at thermodynamic and 3D printed prototypes. Sounds fancy I know but there is several practical lesson’s leant this week. As part of the expansion of our FatigueM8 trials we had to purchase additional hardware and as is typical with technology hardware there was a new model for one of our components. Using the tried and true “bigger and newer is always better principle we upgraded. In a previous post we looked at the change in USB and network port location, if you haven’t read it already you can find it here

Having overcome the port switch, using our bush mechanics skills, fast forward a few months and we noticed some reliability issues with a couple of the devices, odd error messages started to occur python modules “missing” and some other strange/uncharacteristic errors. Dr Google suggested that these were the result of a corrupted hard disk, which I thought was odd as we hadn’t had any corruption issues with our earlier devices. Initially I thought this corruption may have been caused by heat, as it turns out the new model is bigger and better, which in electrical devices typically generates more heat. We ran a couple of tests and did see that the knew model runs about 10 degrees hotter than the previous generation. 10 degrees is a reasonable difference and we thought that allowing some more air flow through the FatigueM8 might do the trick. It was simple enough to drill some 25mm holes through the sidewalls if the unit (see photo below). 

FatigueM8

Our units are made of a 3D printed resin and it is easily modified; and as it turns out easily heated by the spinning drill bit! In hind sight I should of obvious that when I used a hole saw to drill bit to drill the holes the friction of the drill bit on the plastic resin would generate heat. It wasn’t until I tried to pull the cover off and re-install the compute unit that I realised by drilling the holes we had fused (melted) the inner and outer casing together (doh)! If you look closely at this picture you can see the merged black and green layers.

zoomed in view of the merged layers

The only way to recover the inner casing for re-deployment was to break the outer casing and that was the end of that cover.

Broken outer casing

Luckily we keep a range of spares!!

The modifications allowed for more airflow and with a rebuilt hard disk back into the trial we headed. While the modification appeared to increase air flow and reduce the temp slightly, on re-installation into the test vehicle the compute unit reported several new errors. These errors again I referred a corrupted hard disk. Luckily, the compute unit has a built in hard disk test program and what do you know, the old spec hard disks aren’t sufficiently fast to handle the speed of the new compute unit leading to segmentation faults and disk corruption!! 

The hard disks the mini-computer uses are pretty cheap, with then original units were in the order of $10 each and the new version will be $20 a unit. Fingers crossed we have this little hiccup sorted now.

Until next time, stay save.

Attachment.png

The Learning continues into 2021

The start of 2021 saw us road tripping into Queensland to service the units we installed in the back end of 2020.

Trip 2, Lesson 1: New components force some modifications on the go!

Winning the ICON Grant September 2020 (thanks CBRIN and the ACT Government) meant we had to somewhat rapidly expand out FatigueM8 fleet from 5 to 10 units. Our FatiguM8’s are made up of several “off the shelve” components and as with all technologies every few months there are new versions released, updates, enhancements and as it happens subtle yet important layout changes.

The process we follow to assemble the FatigueM8 compute units is well refined now, after building over 23 prototypes now. The process starts with the installation of the operating system and configuring the various options; next the specific software components are installed and finally the FatigueM8 code base. We then run through a series of connection tests for the ECG unit, GPS and testing the LED lights. When all the tests pass, we assemble the FatigueM8 unit.

It was at the point of assembly that we noticed a subtle, yet important change in the computers layout. In the latest model, the USB and Network ports have been switched (no idea why!). We us the USB port to connect a 3G/4G modem to enable almost realtime up load of data for analysis; and remote connection.

Before (left) and After (right) pictures of FatigueM8 front plate.

Fortunately our prototypes are exactly that, prototypes and allow for quick tweaks without major cost implications. As was the case in Lesson 1 above, a hotel room was able to be converted to a mini-workshop and it was Bunnings to the rescue this time. Grabbing a small push saw and rasp, 3 minutes later we’d extended the USB whole to account for the layout switch. We’ll incorporate this new design into the next FatigueM8 print run.

Trip 2, Lesson 2: What happens when the backup, backups’ fails?

The starting premise of FatigueM8’s steering wheel installation is that the drivers shouldn’t have to do anything other than drive to use the system. To facilitate this we have the ECG wired into the truck’s electrical system, with a battery that is charged when the trucks lights are on. FatigueM8 uses the battery power when then the vehicles lights aren’t on and/or the truck is turned off. The battery is able to power the ECG unit for roughly 5 days and during the year this has worked seamlessly with our trial trucks.

Coming back from the 2020 Christmas break several of our trucks had been off the road for 2 weeks (or there a bouts) and the FatigueM8 systems came back online but had no ECG unit connection. After several days of debugging and speaking to the ECG Unit manufacturer we discovered there is another tiny battery inside the ECG unit itself, which provides power to the internal clock. We discovered that the life of the clock battery is about 5 days and when it goes flat if puts the ECG unit into a “safe state” that requires a hard reset. We’ll thank 2020 for the year that kept on giving for this one 🙂

Trip 2, Lesson 3: Securing the dashboard unit needs some work!

Our FatigueM8 dashboard unit (which contains the compute unit) also has a forward facing camera that we use to capture the road/driving conditions our drivers are operating in; and is designed to sit on the trucks dashboard. This sounds simple enough, but as it turns out there isn’t much consistency in dashboard layouts; even within the same brand and model of truck. Recently I went to check in on a couple of our installed units and found one upside-down! In this instance we’d underestimated the amount of road vibrations coming into the cab and this truck travels several times a day along a dirt road for 50kms.

We’re swapped the unit from the drivers side over to the passenger side of the truck and used a humble cable tie to secure the unit to the air vent and hopefully in place! We’ll check back in a month or so.

When we installed our units wee used a small “occy strap” to secure the unit, but it appears we need a little extra securing. Another of our trial units used Velcro to stick the unit in place, which seams to work well.

We’ll be working on the Dashboard unit over the coming iterations with a focus on securing the unit, as well as making the design of the unit more adaptable to different dashboard configurations.

Until next time, stay safe.

Lessons from the late 2020 FatigueM8 installations

Trip 1, Lesson 1: There isn’t many things that K-mart isn’t able to fix!!

In my preparations for the trip to FNQ we had built three (3) new FatigueM8 compute units, taking our total builds at that point in time to fourteen. As part of the pre-installation checks I noticed that one of the software components hadn’t been configured. Real VNC isn’t part of our core stack and doesn’t effect the operation and collection of thee ECG, but it is critical for accessing the remote device for debugging. When connected to our network at build time, configuring Real VNC is easy; just establish an ssh session, connect to the device and enable it and then connect using thee Real VNC viewer, job done. However, when outside the office and connected to Telstra’s 3G/4G network it’s a little harder. 

After scratching my head for couple of hours, and thinking a little outside of the box; I remembered that the compute unit has USB and HDMI ports, which means it can be setup as a computer. The only issue, I didn’t have a spare Keyboard, Mouse or Monitor in my carry on luggage. Enter K-Mart. K-Mart stocks a small range of computer peripherals and I was in luck, K-Mart Mount Isa to the recuse. With a new keyboard, mouse and HDMI capable I headed back to the hotel; Using the HDMI port on the television I was able to turn the FatigueM8 compute unit into a mini computer, login and configure Real VNC to enable remote connections. Problem Solved. 

FatigueM8 converted into a computer, thanks to K-Mart!

In only a weeks’ time this effort to setup remote debugging would prove worth every moment of effort to setup (more on that later).